Module Oplot
Simple mathematical plotter library for ocaml with fast graphics (opengl), LaTeX display, and high quality vector output (xfig, postscript or PDF)
Source available on github.
OplotSimple mathematical plotter library for ocaml with fast graphics (opengl), LaTeX display, and high quality vector output (xfig, postscript or PDF)
Source available on github.
Oplot can be used in the toplevel. First load the library with
  #use "topfind"

  #thread

  #require "oplot"
You may open the Oplot.Plt module for easy access to all plot functions.
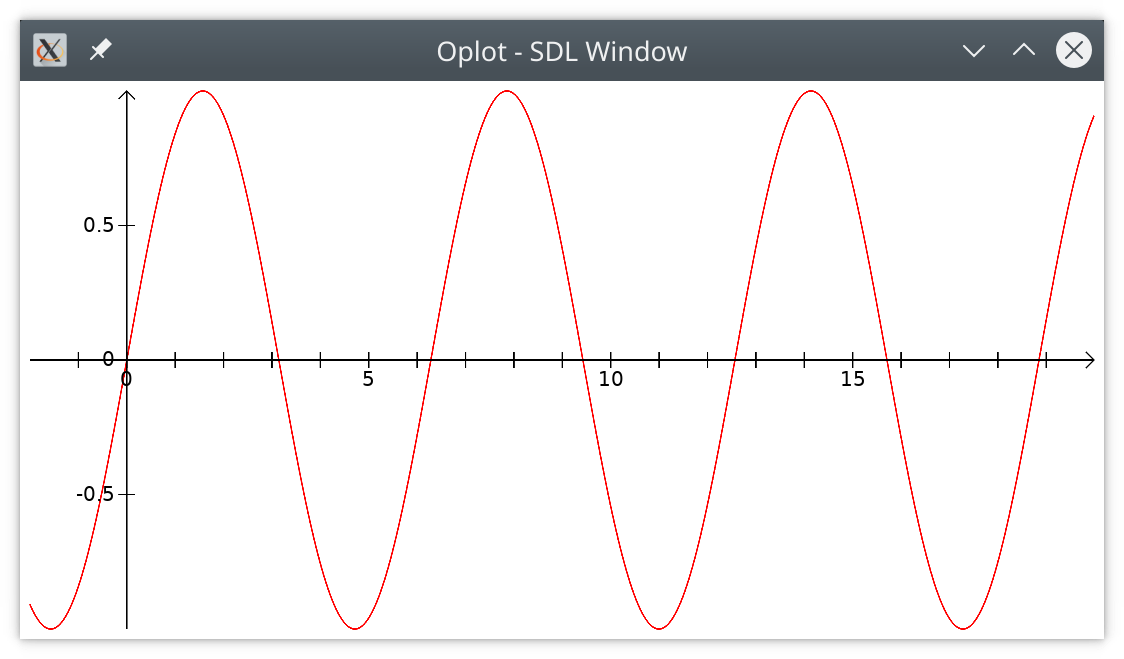
open Oplot.PltDraw the graph of the sine function with
  let p = plot sin (-2.) 20.
  let a = axis 0. 0.;;

  display [ Color red; p; Color black; a ]
This will open a window with the graphics, which should look like this:
Press F for fullscreen toggle, CTRL-S for saving the image, and ESC or Q to close the window. Press h to see the list of active keys.
Of course you can play with it:
  let rec sh i =
    if i == 0 then []
    else
      let p =
        line_plot_f
          (fun x -> sin (x +. (float_of_int i /. 50.)))
          0. 20. ~step:0.05
      in
      let c =
        color (float_of_int i /. 50.) (1. -. (float_of_int i /. 50.)) 0.
      in
      c :: p :: sh (i - 1)
  ;;

  display (sh 50)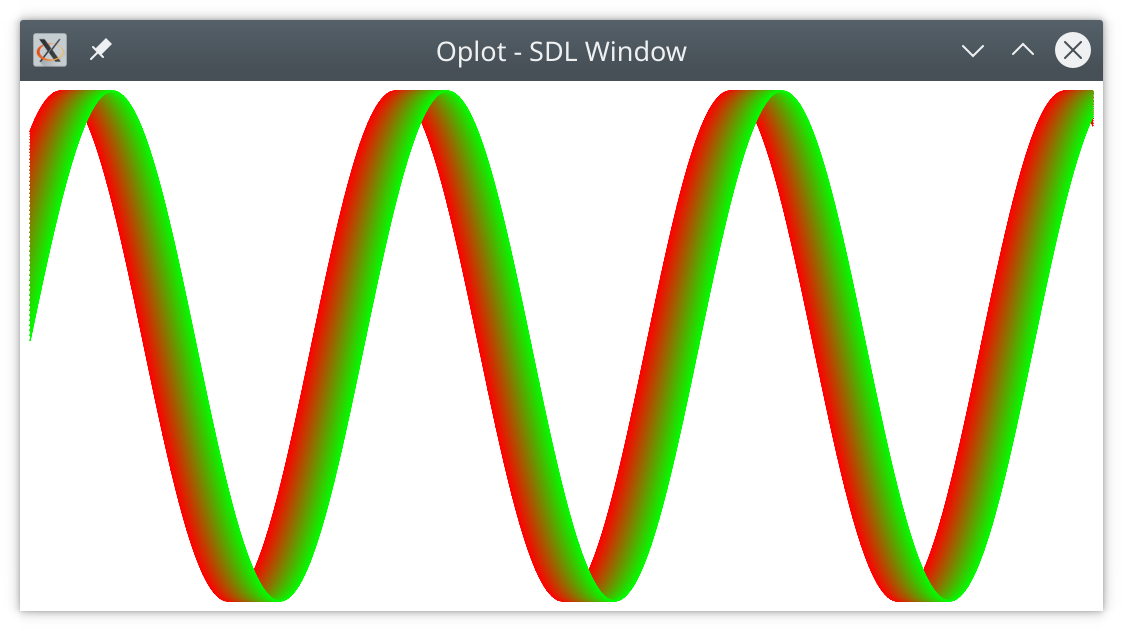
module Points : sig ... endTypes of points (2D or 3D).
module Debug : sig ... endmodule Plt : sig ... endThis module contains all plotting functions.
These signatures allow you to add another backend. An example is to use the old Graphics library, see oplot-graphics.
module type S = sig ... endmodule type GRAPHICS = sig ... end